Finding the Perfect Fit: Study Design as the First Step to Address Your Research Question
Understanding the science of data
This article was published in MedinLux and is part of a collaborative effort to make statistical and epidemiological concepts accessible to healthcare professionals in Luxembourg.
Every study addresses a specific question. This question plays a crucial role in choosing the type of study, which will, in turn, determine the statistical analyses to be conducted. These analyses must be defined early (even prior to having the data to avoid being influenced by it; see the article on p-values). In this article, we will introduce various types of studies to help you answer your research question more effectively, along with their advantages and disadvantages. The type of study varies depending on the research objective: if the aim is to study the relationship between an exposure and a disease, experimental studies will be most appropriate. On the other hand, if the objective is to describe a disease or an event in relation to a location, period, or specific population, observational studies are better suited.
INTERVENING TO EVALUATE
Experimental studies, and randomized clinical trials in particular, aim to assess the effectiveness of a new treatment (device or medication) by comparing it to a placebo or a reference/standard intervention, with participants randomly assigned to interventions (randomization).
One of the characteristics of these studies is the allocation of participants. Depending on the type, treatment allocation differs. Numerous designs exist: the most common is the parallel group study. Participants are randomly assigned to one group or another, sometimes ensuring that the groups have common characteristics (e.g. the same average age, the same proportion of men and women, or the same distribution of disease severity). Groups are followed simultaneously and independently.
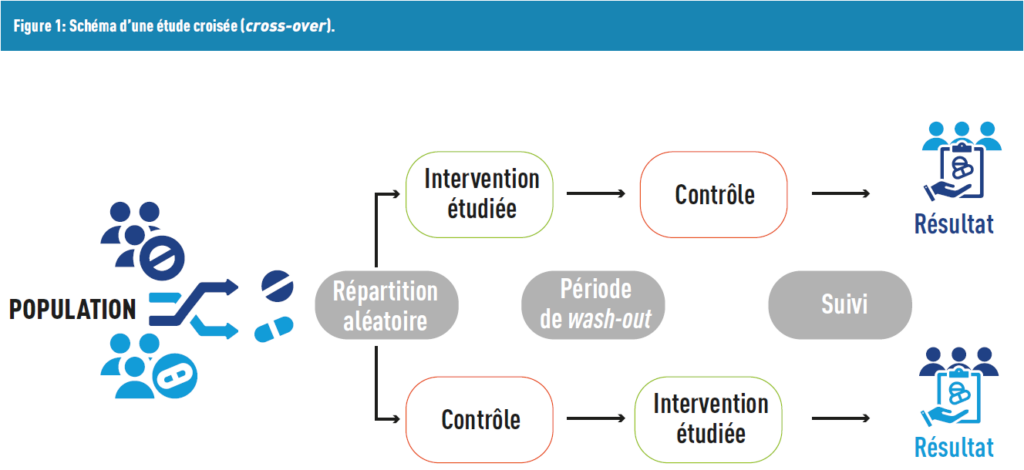
Another type of design corresponds to crossover studies, where each participant acts as their own control. In this design, participants receive a treatment, after which there is a washout period during which no treatment is administered to eliminate the effects of the first treatment. Finally, each participant receives another treatment that they did not receive during the first period (Figure 1).
This list is not exhaustive: other innovative and complex approaches exist, such as basket, umbrella, adaptive, or platform studies. However, their description is beyond the scope of this article.
Group allocation can be single-blinded (only the participants are unaware of whether they are receiving the placebo/reference treatment or the new treatment) or double-blinded (neither the participants nor the researcher know the treatment details). This limits the placebo effect, defined as a perceived improvement (or deterioration) by the participant without receiving any active components in the treatment.
Randomized clinical trials are considered the gold standard for acquiring evidence and establishing causality, as many influential factors are controlled. However, this type of research is time- and resource-intensive.
NOTE FROM THE BIOSTATISTICIAN
Data can be analyzed using:
Intention-to-Treat (ITT): Participants are considered as they were initially randomized, even if they did not fully adhere to the initial treatment protocol. ITT analysis aims to avoid biases in interventional research, such as non-random attrition or treatment group crossovers. This practice is recommended by the Consolidated Standards of Reporting Trials (CONSORT). However, a critique of this approach is that it is conservative, making it more prone to type II errors (see the article on p-values).
– Per-Protocol Analysis (PPA): Participants who deviated from the protocol are excluded. Due to dropouts (for inefficacy, side effects, etc.), the total number of participants is lower than planned, reducing statistical power. A sample size calculation is necessary to address this issue. Randomization benefits are lost, and groups may become unbalanced. Furthermore, this does not reflect conditions of real life where patients do not strictly follow their prescriptions.
OBSERVING TO BETTER UNDERSTAND
As previously mentioned, observational studies are characterized by not actively intervening in the studied population. They focus on the effect of risk factors, diagnostic tests, or treatments without influencing the exposure. These studies are divided into two categories: descriptive studies and etiological studies.
GETTING A GENERAL PICTURE
In descriptive studies, the objective is to describe health phenomena within a population. These studies concentrate on trends and characteristics of the population under investigation. However, they cannot establish cause-and-effect relationships or explain the reasons behind the phenomenon. A simple example is the study of the number of flu cases during the winter of 2023–24 in Luxembourg.
Among descriptive studies, cross-sectional studies analyze one or more populations at a specific point in time. This approach estimates prevalence, which is the ratio of individuals with a specific disease to the total population, often expressed per 10,000 or 100,000 people, without distinguishing between new and existing cases. The sample should be representative of the target population to ensure an unbiased prevalence estimate. This method can be compared to taking a snapshot of the observed population, such as the European Health Interview Survey (EHIS), conducted by the European Commission.
Another example is ecological studies, which have a broader scope. Here, the units of analysis are groups (cities, regions, or countries), while previous studies focus on individuals within groups. In ecological studies, data is aggregated from external sources, making individual-level data unavailable. These studies are relatively easy, fast, and low-cost to conduct, typically using already existing data. They aim to “pave the way” for more robust cohort or case-control studies by identifying potentially interesting associations. One historical example is John Snow’s study of the cholera epidemic in London, where he mapped cases by neighborhood. This study marked the beginning of epidemiology, introducing concepts such as incidence (the number of new cases of a disease over a specific period).
COMPARING GROUPS
Etiological studies aim to identify links between various factors (environmental, genetic, behavioral) and the onset of diseases, for example. Unlike interventional studies, controlling for certain factors is not feasible. One major limitation of observational studies is the presence of biases that are difficult to manage. The most notable is selection bias, which occurs when the studied population is not representative of the target population. However, the list of biases is long (confounding, measurement, information…) and will be explained in a future article!
CASE-CONTROL STUDY
These studies distinguish two groups: one with the health issue (cases) and another without it (controls). Individuals in the control group share similar characteristics (age, sex, etc.) with those in the cases group. Matching the groups reduces individual variability. This design is commonly used for studying rare diseases.
COHORT STUDY
Cohort studies are suitable for researchers interested in a defined population with varying levels of exposure to risk factors, such as workers (population) exposed to (or not) a toxic gas-emitting machine (risk factor). These studies are particularly useful for analyzing short-incubation diseases, chronic conditions with multiple stages, or relatively common diseases. They can be specialized (small sample sizes, highly specific problems, detailed data) or more general (large-scale, covering a wide range of health issues, with less specific data). Additionally, they serve as a basis for further research, such as the CLINNOVA project involving the Luxembourg Institute of Health (LIH). This project collects data from multiple European cohorts to improve treatments for three inflammatory diseases (intestinal, rheumatoid arthritis, or multiple sclerosis) using artificial intelligence.
BEFORE OR AFTER THE DISEASE DEVELOPS?
Another critical question is the timing of studying the population: should it be before or after they develop the disease?
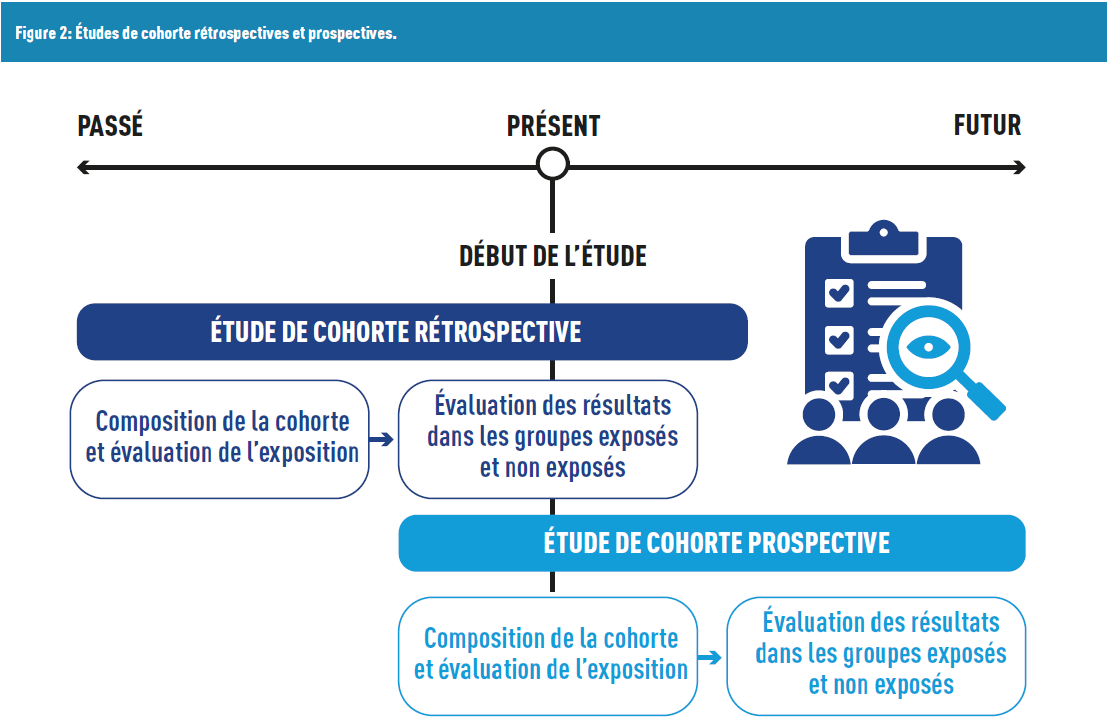
In the first case, we are dealing with retrospective studies, where participants already have the disease, and researchers “look back” to identify exposures or potential risk factors. A limitation of this approach is recall bias: participants may struggle to remember past exposures. This bias can be minimized when medical records are accessible, and their data can be integrated (with participant consent, particularly to comply with the General Data Protection Regulation (GDPR)).
In the second case, we have prospective studies, which aim to identify risk factors to predict the future occurrence (or non-occurrence) of a disease. These studies have a forward-looking timeline. They are generally more costly due to their duration (as participants are observed until they develop the disease).
MEASURING THE SAME INDIVIDUAL OVER TIME OR DIFFERENT INDIVIDUALS ONCE?
Among observational studies, longitudinal studies (also called panel studies) follow the same sample over time, which could span days, months, years, or decades, depending on the research question of interest. The goal is to detect changes in participants and investigate the association between known or suspected exposures and disease onset. One of the first and most famous examples is the Framingham Heart Study, which began in 1948 in the United States and is still ongoing up to this day, focusing on cardiovascular diseases and their determinants.
It is essential not to confuse data from longitudinal studies with data from repeated cross-sectional studies. In the latter, repeated measurements are made on different individuals, whereas the former tracks the same individuals over time.
HOW TO EVALUATE STUDIES?
In clinical practice, decisions made by doctors can be guided by several approaches (defined by Isaacs and Fitzgerald [3]):
- Tradition: You have always prescribed this treatment for patients with this condition.
- Experience: From your practice, you’ve observed that this treatment works better.
- Expert Opinion (Eminence-Based Medicine): You consulted a recognized specialist in the field and relied on their advice.
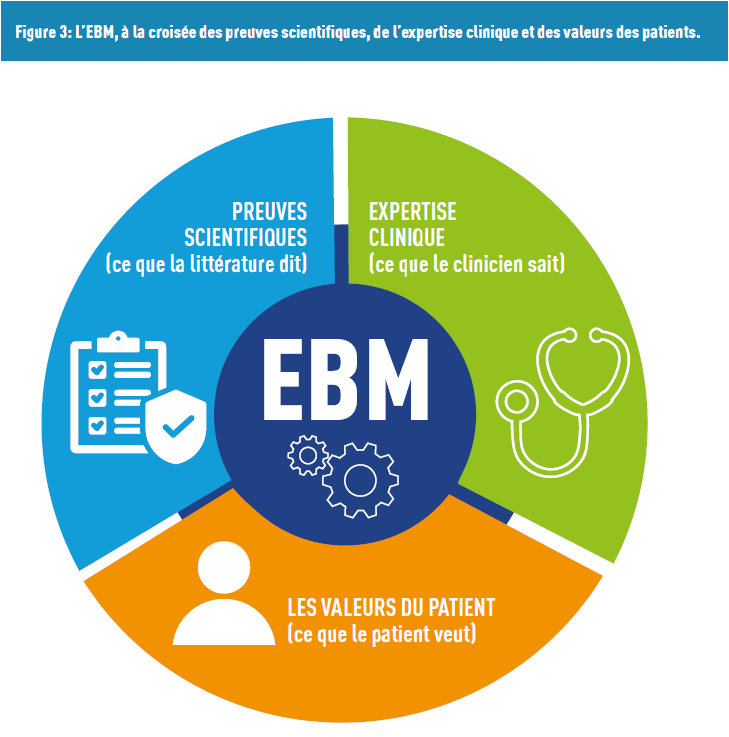
These approaches are often contrasted with Evidence-Based Medicine (EBM). Born in the 1950s, this concept blends principles and methods, taking into account the physician’s expertise, research advancements, and patient values (Figure 3).
In this context, not all information from scientific literature has the same level of evidence. Several methods exist to assess these studies.
First, the GRADE tool (Grading of Recommendations Assessment, Development and Evaluation) is used by over 100 organizations worldwide to evaluate study quality and make recommendations. Certainty levels range from “very low” (the actual effect can easily be very different from the estimated effect) to “high” (the authors are highly confident that the estimated effect is representative of the actual effect). This scale considers factors such as bias risk, imprecision, or lack of consistency (with existing studies).
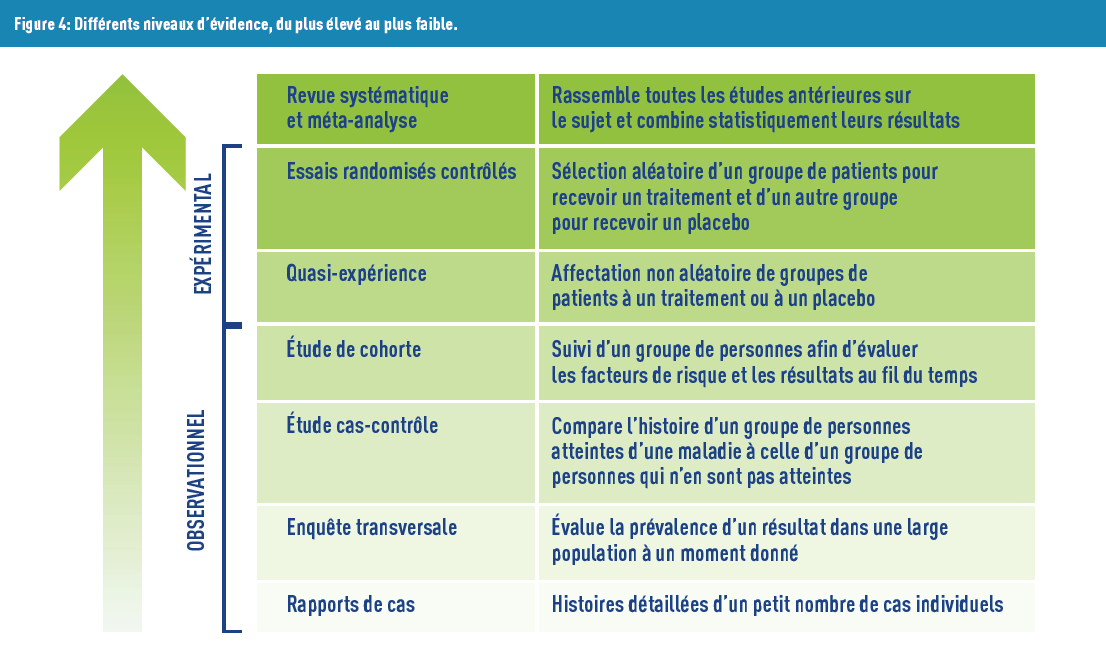
Second, levels of evidence have been created and are supported by the scientific community and many institutions (World Health Organization, French Haute Autorité de Santé, etc.). The lowest level is “expert opinion”, followed by “case series” (or “case reports”) because they involve a small number of people and their conclusions are difficult to generalize to larger populations. Conversely, the highest level includes “meta-analysis”, a statistical research method that combines analyses from multiple studies on the same topic. The first step of this method involves conducting a systematic literature review with predefined criteria, followed by extracting information from each selected relevant article. The final step is to obtain an overall effect estimate, considering heterogeneity between studies, often represented by forest plots (Figure 4).
However, Every Tool Has Its Criticisms. On one hand, there can be publication bias, where only studies with “interesting” results are published and are thus made accessible. This bias impacts meta-analyses (among others), where only “interesting” studies may unintentionally be included.
On the other hand, randomized clinical trials are considered the gold standard for evidence. Although they involve patients with a single, carefully selected condition, extrapolating results to different populations can be challenging! This issue is particularly significant for elderly patients, who are often underrepresented in studies. However, geriatric trials are being conducted with increasing frequency, to test treatments in the presence of multimorbidities comorbidities affecting these patients.
IT’S NOT JUST ABOUT THE NUMBERS!
This summary only has only considered studies that quantify phenomena so far, although qualitative studies also exist. These are typically based on focus groups or individual interviews involving a limited number of participants (e.g. Delphi method). This approach helps understand participants’ experiences, perceptions, and behaviors. Its advantages include flexibility and generation of new ideas. Conversely, the information is subjective, comes from usually small samples (making generalization to larger populations difficult), and is thus not always reproducible.
Once you have selected the type of study that addresses your research question, calculating the sample size (or statistical power) ensures sufficient “strength” to validate your findings (see the previous article on p-values).
In the next article, we will explore the concepts of association and causality. Feel free to send us your questions on specific epidemiological or statistical topics, and we will address them in future articles.
TAKE HOME MESSAGE
The table below summarizes the various concepts explained in the article:
| QUESTION ASKED | TYPE OF STUDY |
|---|---|
| Does test X detect lung cancer more effectively than test Y? | Randomized trial |
| What is the incidence of lung cancer in Luxembourg? | Cohort study |
| What is the prevalence of lung cancer among smokers? | Cross-sectional study |
| Do people exposed to second-hand smoke have a higher risk of lung cancer? | Case-control study, cohort study |
| How do patients with lung cancer perceive their health? | Qualitative study |
Réferences
- 1. https://ec.europa.eu/eurostat/statistics-explained/index.php?title=Glossary:European_health_interview_survey_(EHIS)
- 2. https://www.lih.lu/fr/article/clinnova-lance-une-initiative-de-medecine-de-precision-au-coeur-de-leurope/
- 3. https://www.bmj.com/content/319/7225/1618
- 4. https://gdt.gradepro.org/app/handbook/handbook.html
The epidemiostatistical series published in MEDINLUX.
Related News