Mastering statistical and epidemiological tools to better decipher scientific articles
Understanding the science of data
This article was published in MedinLux and is part of a collaborative effort to make statistical and epidemiological concepts accessible to healthcare professionals in Luxembourg.
The clinician serves as the link between the scientist, who generates information through their research, and the patients, who seek the most effective care possible. Information derived from peer-reviewed scientific journal articles has a significant impact on clinical practice, especially in the era of “evidence-based medicine”, as it forms the basis for recommendations issued by professional societies. Information from medical literature allows clinicians to stay up-to-date with the most recent medical discoveries and, consequently, the most effective and/or best-tolerated treatments applicable to their field of expertise. Given these considerations, an ability to read those articles critically appears fundamental in assessing the validity of published results (i.e., the conditions under which they are applicable) and their relevance to practice. This article aims to provide several essential tools for critical interpretation of scientific articles and their conclusions.
THE CHARACTERISTICS OF MEDICAL INFORMATION
A Long and Complex Process
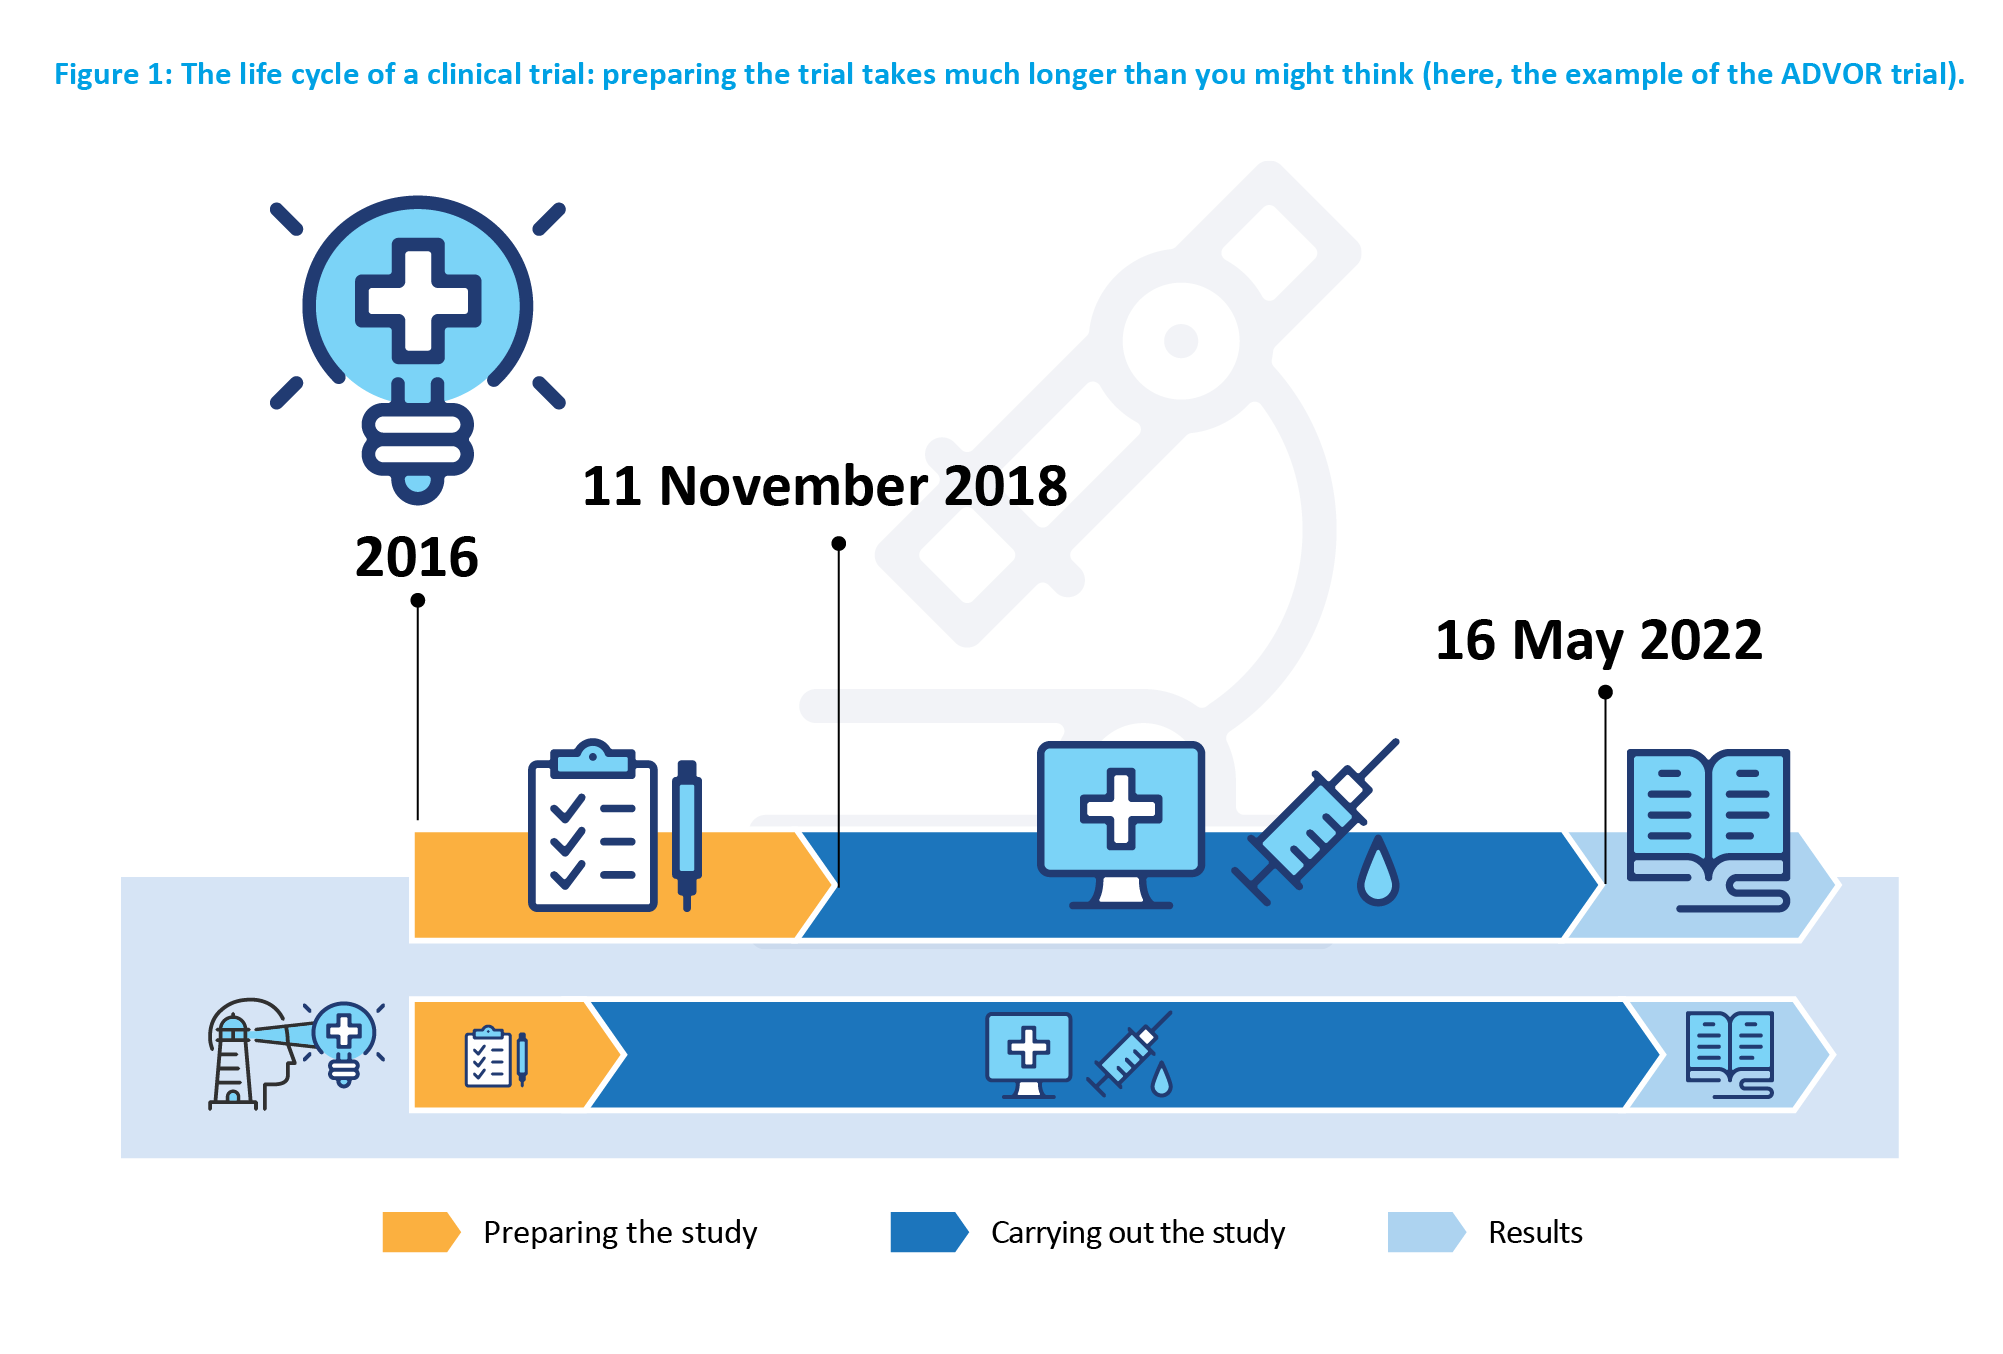
In the age of digital content and instantly delivered news, the information is quick, brief, and immediate. In contrast, production of a scientific article is the culmination of a long research process, typically spread over several years. In practice, a typical study may be broken down into the following stages: formulating the question, conceptualizing the method to answer it, recruiting participants, collecting the data from those participants into a data warehouse, analyzing these data, and, interpreting the results with reference to the context (Figure 1).
Furthermore, the volume of data accumulated in the research world is increasing considerably. The job of managing such data has evolved into a distinct profession: clinical data manager. Put simply, a data managers’ role is to structure, verify the consistency and reliability of data, and prepare them for statistical analyses. The higher the quality of the database is, the more relevant and precise the analysis will be.
A fruitful field
Recent bibliometric studies show that the number of scientific articles published has increased by 8 to 9% per year over the past decades (1). For instance, the database containing scientific articles in the medical and life sciences domain, PubMed, numbered nearly 1.4 million articles in 2022, even though this is still an underestimated figure. Indeed, as it does not include “grey literature” from other sources (particularly, governmental reports, working papers, etc.) or, of course, unpublished studies (when a treatment proves ineffective or there is insufficient statistical evidence), the volume of information would be even larger, making it challenging to access.
Swift Obsolescence
Such high rates of publications proliferation lead to information inflation and to a rapid obsolescence of medical knowledge.
Variable Quality
The quality of publications is generally ensured by the peer review step conducted in the process of publishing. However, having a skill to independently evaluate the quality of the research is a valuable skill for a reader, as Misuse of these articles can lead to incorrect results or interpretations (see the example below), which can have detrimental consequences on clinical practice. Furthermore, authors’ intentions can be misunderstood and, ultimately, misinterpreted. Fortunately, many guidelines exist, providing a framework for research and its quality (2). This is why a critical reading of scientific literature, while putting information into perspective, is fundamental.
The Importance of Privacy Preservation
Evaluation of information also requires collecting and managing about its source. This holds true in general, but even more so for medical information, which is particularly sensitive. Therefore, management of private data, governed by the General Data Protection Regulation (GDPR), is a fundamental step in any study. Thoughtful collection, storage, and securing of data are significant factors in maintaining data integrity and ensuring the privacy of participants. Appropriate IT tools are essential for safeguarding and utilizing the data.
Misinterpreted or Misused Information
The COVID-19 crisis revealed a certain level of public interest to epidemiology (3) and statistics, despite a lack of necessary knowledge for understanding these concepts. Consequently, although this attention is eventually beneficial, incomplete or incorrect messages were disseminated (4), sometimes intentionally. Everyone remembers the toxic climate of ultracrepidarianism and conspiracy theories. In this context, the term “infodemic” (or “infodemiology”) was coined by various organizations, including the World Health Organization (5), to emphasize the importance of detecting false or misleading information.
TWO EXAMPLES
From the above, we can imagine the sheer volume and complexity of medical information. Among the possible pitfalls, we encounter incorrect interpretation of results (first example) and research affected by certain biases, either intentionally (second example) or unintentionally.
1st Example
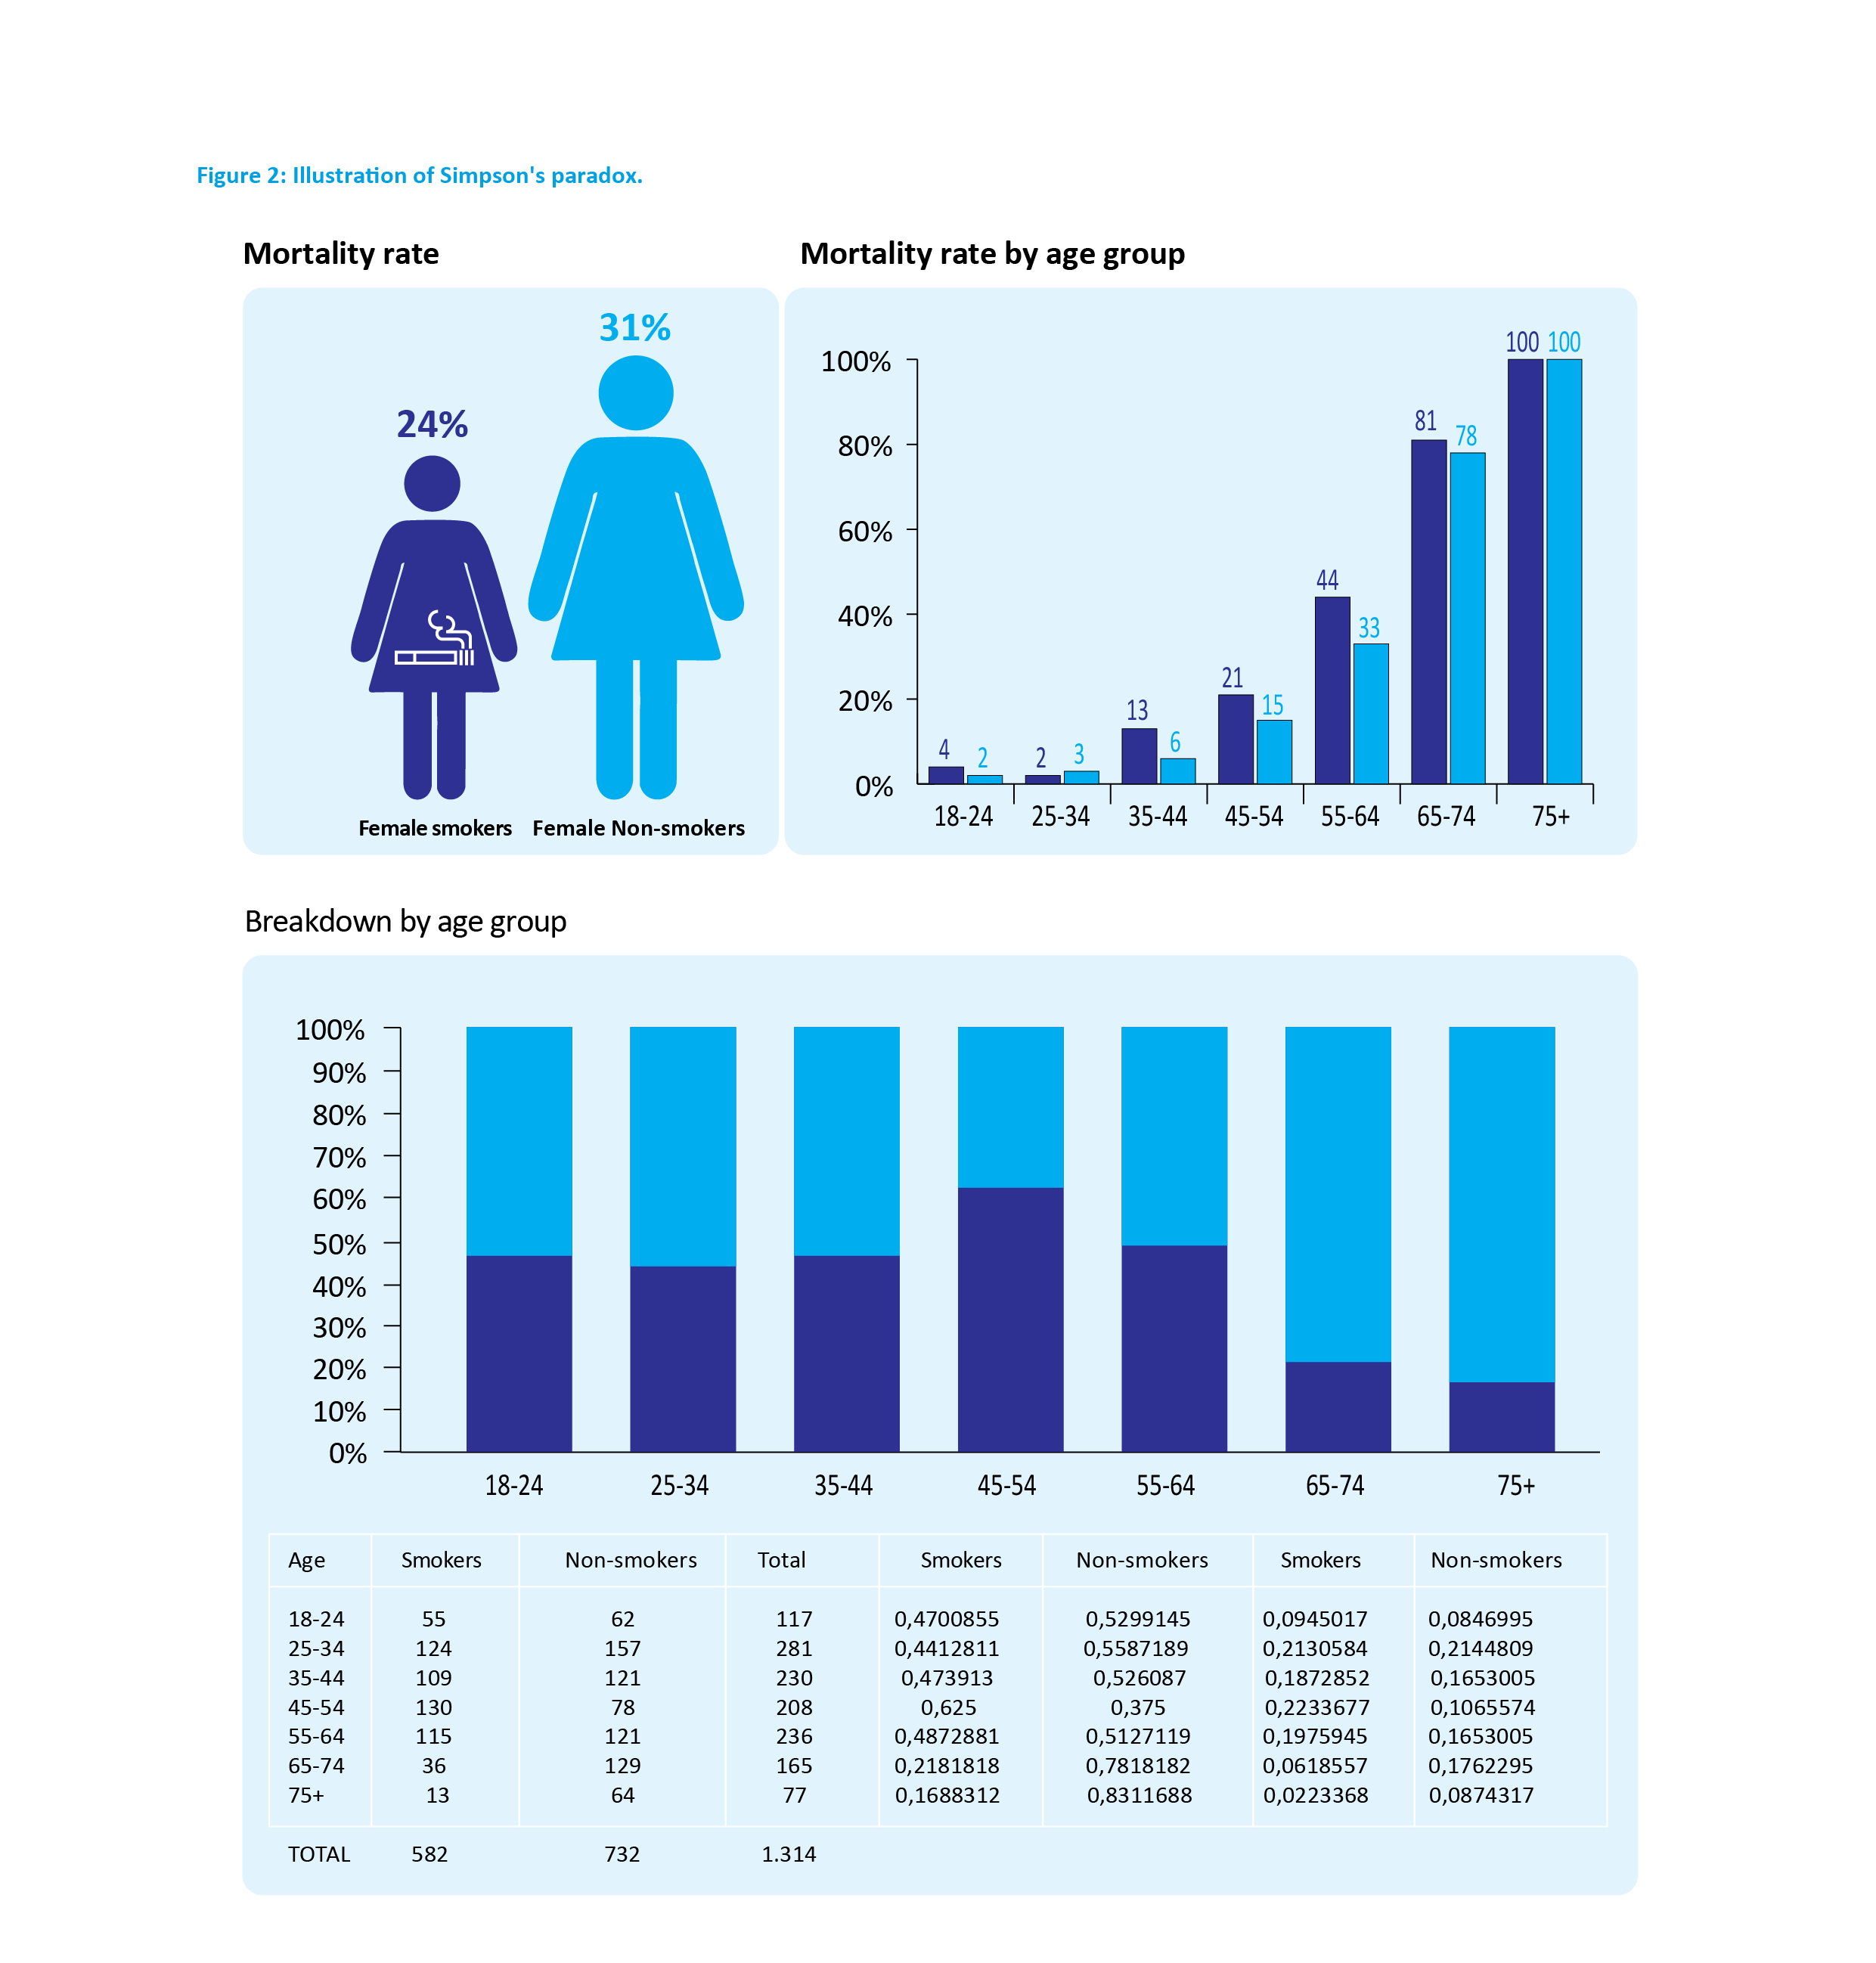
The use of statistics can lead to results that are completely counterintuitive, even though they have been rigorously demonstrated. These are referred to as paradoxes – the results that are not false but incompatible with our intuition. One of the most striking statistical paradoxes was described by Edward Simpson in 1951, which states that it is possible for the same phenomenon to occur within different groups, but this phenomenon reverses when the groups are combined (6).
2nd Example
Another notable example is that of the MMR vaccine (measles, mumps, rubella). In 1998, the journal “The Lancet” published an article linking the combined MMR vaccine to autism. Dr. Andrew Wakefield and 12 other co-authors found an association between the loss of acquired skills (including language) and the administration of this vaccine. Several years passed before it was demonstrated that the information was false and the article was retracted (8). In the meantime, the study’s results had been widely publicized, generating distrust towards this vaccine (9) and vaccination in general. The British Health Protection Agency attributed a significant measles outbreak that hit the country in 2008-2009 to a preceeding decrease in the number of children receiving the MMR vaccine (8). Several irregularities were identified in the retracted publication. Firstly, Wakefield’s research was partially funded by the lawyers representing parents involved in lawsuits against vaccine manufacturers. Secondly, the study cases were not part of a consecutive series, as claimed, but had been chosen selectively (selection bias). Moreover, the number of observations was very low (a total sample of 12 children) and was insufficient to demonstrate a real connection (problem of test power). For the record, Andrew Wakefield was excluded from the Medical Register in 2010 and has become a prominent figure in the international anti-vaccine movement.
These examples illustrate the potential for manipulation that can be concealed within a study: false information can become “real.”
A TOOLBOX FOR UNCOVERING DATA
Statistics can be seen as a set of tools to “reveal” the meaning of data. A statistician (or data scientist) determines the most appropriate tool for addressing each problem or question. An ill-suited tool will yield results, but they may not be the most accurate and, in the worst cases, could be biased or even false. To illustrate this, imagine that you need to tighten a screw on a machine. The tool you would need is a screwdriver, but you might make a mistake in selecting the shape or size of the screwdriver, or even pick a hammer. Along those lines, within descriptive statistics, an average cannot be calculated for categorical characteristics such as smoking status or gender.
It is also essential to be equipped to read and understand scientific articles, recognizing their specific features, strengths, and weaknesses. The series in epidemiology and statistics series that this first article initiates precisely aims to deliver the essential tools.
In the upcoming issues, various topics will be covered to develop and refine your knowledge of statistics: interpreting the p-value (or “p”) based on the theory of the tests, types of studies (with their advantages and disadvantages), epidemiological and clinical trials, sample size and power calculations, biases, measures of association and causality, diagnostic tools, and systematic reviews and meta-analyses… Each time, we will draw on examples from recent literature.
In the end, you will not mix up statistical significance and clinical relevance, relative risks and absolute risks, you will be aware of the limitations of retrospective or non-inferiority studies, you will learn to identify biases in a study protocol, you will understand the advantages of multivariate analyses, ROC curves will (mostly) hold no secrets for you, and much more… Of course, there will be a price to pay, or rather a habit to adopt: looking at the “materials and methods” section… and reading us.
Please feel free to send us your questions on specific topics. We will address them in future articles.
References
- Landhuis E. Scientific literature: Information overload. Nature 2016;535:457-8.
- https://www.equator-network.org/
- https://www.sciencepresse.qc.ca/actualite/2021/06/15/covidepidemiologie-projecteurs
- https://www.pasteur.fr/fr/journal-recherche/actualites/coronavirusattention-aux-fausses-informations-covid-19-circulant-reseauxsociaux
- https://www.who.int/fr/news-room/spotlight/let-s-flatten-theinfodemic-curve
- Berger Q, Caravenna F. Le paradoxe de Simpson illustré par des données de vaccination contre le Covid-19. www. theconversation.com
- Appleton DR, French JM, Vanderpump MPJ. Ignoring a covariate: An example of Simpson’s paradox. The American Statistician
1996;50(4):340-1. - https://www.cmaj.ca/content/182/4/E199
- https://www.bbc.com/afrique/monde-59868419
The epidemiostatistical series published in MEDINLUX.
Related News